Glacier mass balance | Measuring mass balance | Mass balance gradients | Mass balance through time | Further reading | References | Comments |
Glacier mass balance
The mass balance of a glacier is a concept critical to all theories of glacier flow and behaviour. It is simple enough, really: mass balance is simply the gain and loss of ice from the glacier system1. A glacier is the product of how much mass it receives and how much it loses by melting.
Mass balance can be thought of as the ‘health of a glacier’; glaciers losing more mass than they receive will be in negative mass balance and so will recede. Glaciers gaining more mass than they lose will be in positive mass balance and will advance. Glaciers gaining and losing approximately the same amount of snow and ice are thought of as ‘in equilibrium’, and will neither advance nor recede.
For clarification: when we talk about glaciers advancing, receding or being in equilibrium, we are talking about the position of their snout. Glaciers will continually flow under the force of gravity; ice is continually being moved from the upper reaches to the lower reaches, where it melts.
Accumulation zone
The glacier system receives snow and ice through processes of accumulation. Surface accumulation processes include snow and ice from direct precipitation, avalanches and windblown snow. There may be minor inputs from hoar frost. The snow and ice is then transferred downslope as the glacier flows.
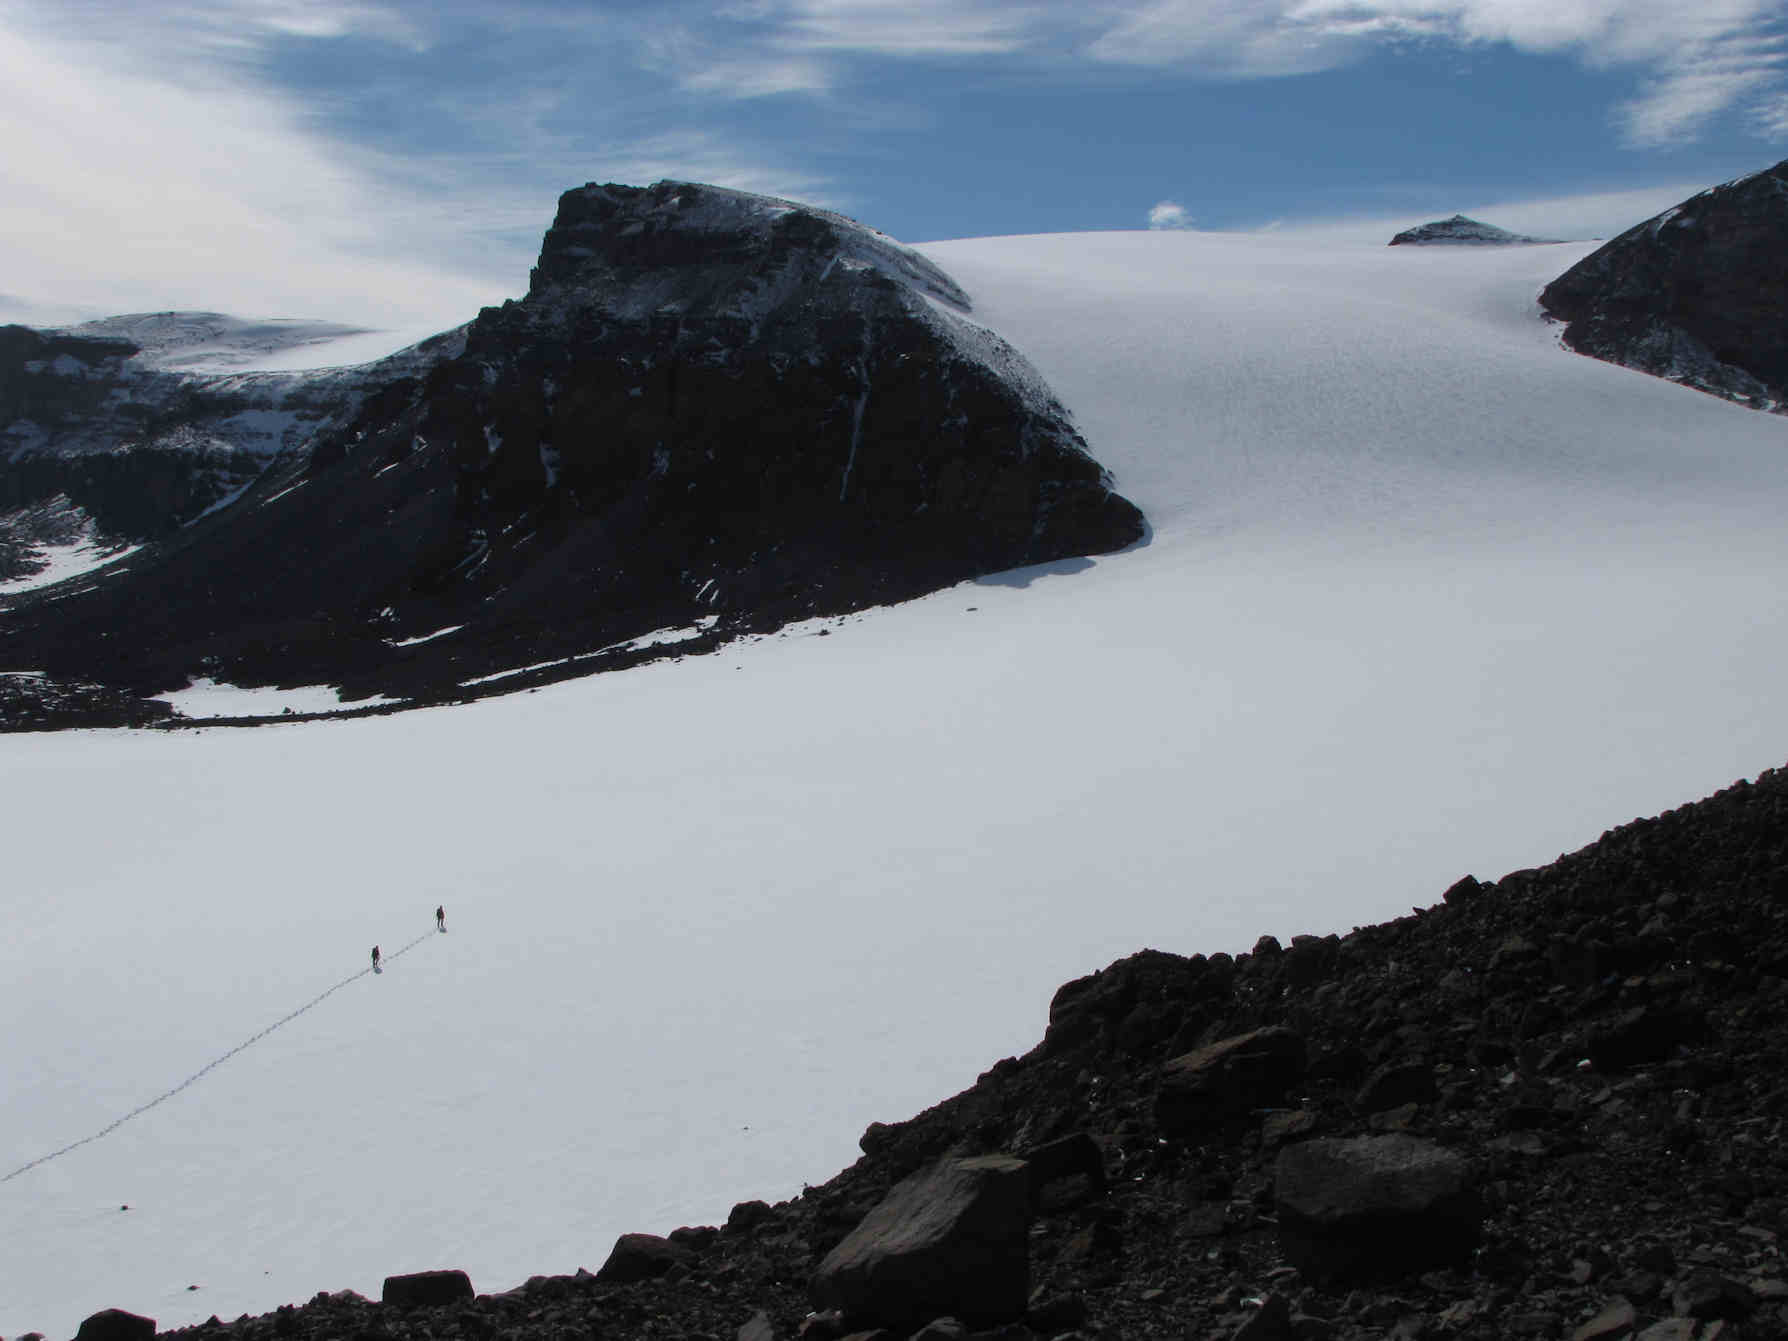
Precipitation falling as rain is usually considered to be lost to the system. Internal accumulation may include rain and meltwater percolating through the snowpack and then refreezing. Basal accumulation may include freezing on of liquid water at the base of the glacier or ice sheet2.
The figure below summarises the inputs and outputs from a glacier system; the inputs are the processes of accumulation (including precipitation (snow, hail and rain) and other sources of accumulation such as wind-blown snow and avalanching.

Ablation zone
The Glaciers as a System figure above summarises the key processes of ablation for a glacier.
Glaciers lose mass through processes of ablation. Surface ablation processes include surface melt, surface meltwater runoff, sublimation, avalanching and windblown snow. Glaciers on steep slopes may also dry calve, dropping large chunks of ice onto unwary tourists below. Glaciers terminating in the sea or a lake will calve photogenic icebergs.
Other processes of ablation include subaqueous melting, and melting within the ice and at the ice bed, which flows towards the terminus2.
Equilibrium line altitude
Accumulation usually occurs over the entire glacier, but may change with altitude. Warmer air temperatures at lower elevations may also result in more precipitation falling as rain. The zone where there is net accumulation (where there is more mass gained than lost) is the accumulation zone. The part of the glacier that has more ablation than accumulation is the ablation zone. Where ablation is equal to accumulation is the Equilibrium line altitude.
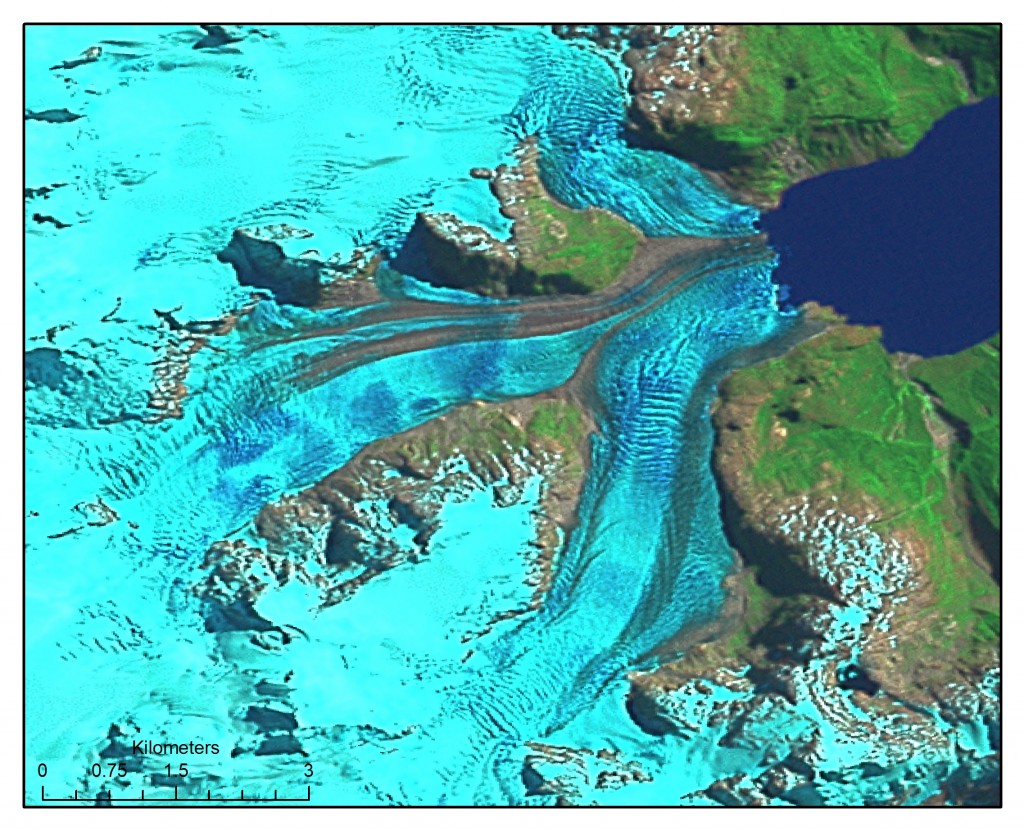
The snowline at the end of the summer season is often used to demarcate the equilibrium line on satellite images of glaciers. Above the snowline, where there is more accumulation than ablation, snow remains all year around and the glacier is a bright white colour. Below the snowline, there is more ablation than accumulation, so there is no snow left at the end of the summer, and the duller, grey-blue coloured glacier ice is visible.
The figure below shows an outlet glacier of the North Patagonian Icefield. The bright white parts in the upper reaches of the glacier are in the accumulation zone; the darker more blue areas on the glacier tongues are in the ablation zone. The Equilibrium Line Altitude here is approximately equal to the snow line.
Accumulation Area Ratio
The Accumulation Area Ratio (AAR) is the ratio of the area of the accumulation zone to the area of the glacier. It is a value between 0 and 1 (Cogley et al., 2011).
The “Balanced Budget AAR” is the AAR of a glacier with a mass balance equal to 0 (i.e., it is in balance with climate, and is neither growing or shrinking). The balanced-budget AAR of non-calving glaciers is usually between 0.5 and 0.6 on average, although the range of variation is substantial, and depends on climatic and topographic factors.
On many glaciers, the AAR correlates well with the climatic mass balance and the ELA. The correlation is inverse; a lower ELA implies a higher AAR.

So what is Glacier Mass Balance?
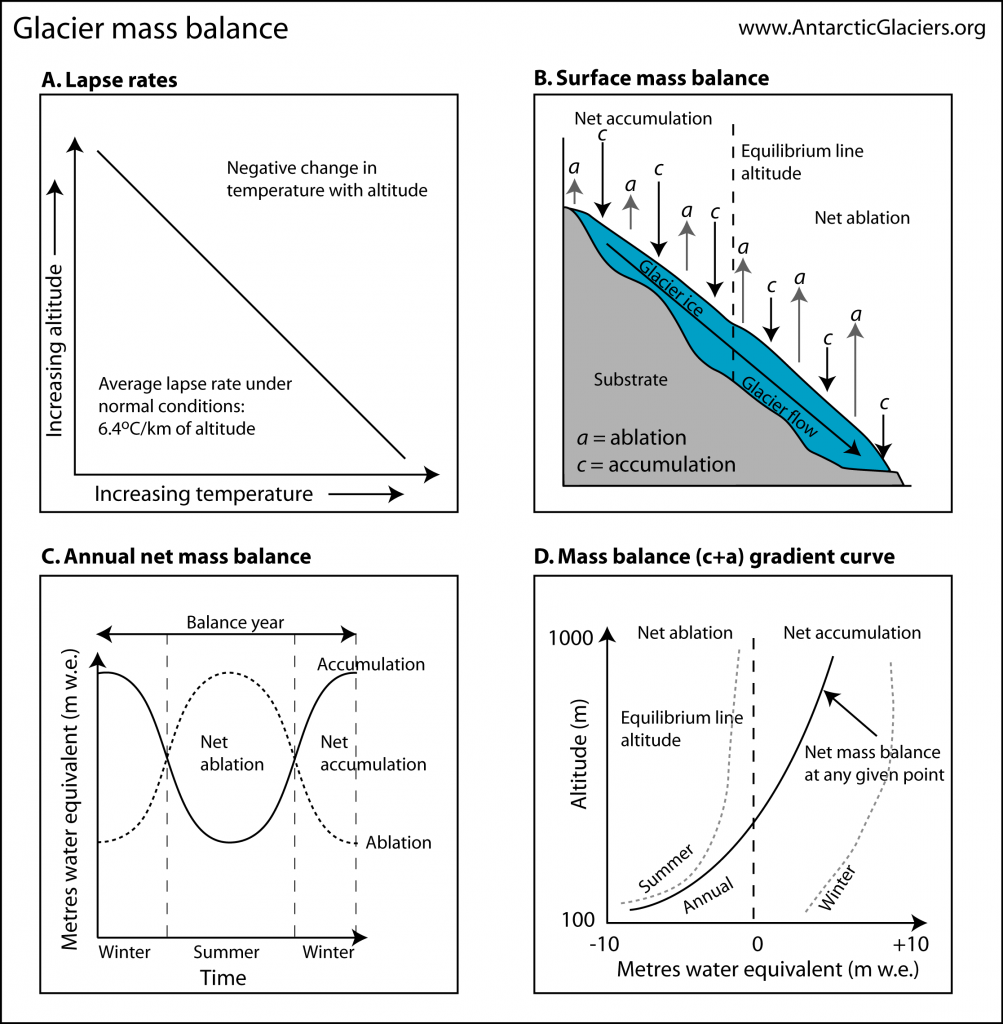
So, glacier mass balance is the quantitative expression of a glacier’s volumetric changes through time.In the figure below, Panel A shows how temperature varies with altitude. It is colder at the top than it is at the bottom of the glacier. This is crucial, as surface air temperature strongly controls melting and accumulation (as in, how much precipitation falls as snow or ice).
Mass balance (b) is the product of accumulation (c) plus ablation (a). Mass balance (b) = c + a Mass balance is usually given in metres water equivalent (m w.e.). It varies over time and space; accumulation is greater in the higher reaches of the glacier, and ablation is greater in the lower, warmer reaches of the glacier (Panel B in the figure).
Mass balance also varies throughout the year; glaciers typically get more accumulation in the winter and more ablation in the summer (Panel C in the figure). Glacier mass balance therefore usually can therefore be expressed as a mass balance gradient curve, showing how c + a varies attitudinally across the glacier (Panel D in the figure). The balance gradient is the rate of change of net balance with altitude3. A glacier’s net mass balance is a single figure that describes volumetric change across the entire glacier across the full balance year.
Measuring Mass Balance
Glacier mass balance is normally measured by staking out a glacier. A grid of ‘ablation stakes’ are laid out across a glacier and are accurately measured. They can be made of wood, plastic, or even bamboo like you’d use in your garden. These stakes provide point measurements at the glacier surface, providing rates of accumulation and ablation.
These methods are time consuming, logistically challenging and arduous; the stakes will need to be visited several times through the balance year. Accumulations and ablation are generally measured by reference to stakes inserted to a known depth into the glacier, and fixed by freezing and packing in3. The location is fixed with GPS.
Automatic weather stations on the glacier surface are key to understanding energy fluxes on the glacier. Probing, snowpits and crevasse stratigraphy are also used to measure mass balance on glaciers, ideally supplemented with stakes.
Remote sensing of glacier mass balance is obviously a good alternative, as it allows many glaciers to be assessed using desk-based studies. It is a cheap and simple alternative to arduous fieldwork, but ground truthing of mass balance measurements will always be necessary. Researchers from Aberystwyth University use satellite measurements to track changes in the mass balance of the Greenland Ice Sheet.
Mass balance gradients
The mass balance gradient of a glacier is a key control in factors such as the glacier’s response time.
A glacier’s mass balance gradient is critically determined by the climatic regime in which it sits; temperate glaciers at relatively low latitudes, such as Fox Glacier in New Zealand, may be sustained by very high precipitation. They will therefore have a greater mass balance gradient (more accumulation, more ablation). These wet, maritime glaciers may have a shorter response time and higher climate sensitivity than cold, polar glaciers that receive little accumulation but also have correspondingly low ablation. These cold, dry glaciers may respond more slowly to climate change.
In the figure above, temperate glaciers with greater mass balance gradients are represented by the shallower lines; more mass is transferred from the top to the bottom of the glacier. Cold, polar-type glaciers with smaller mass balance gradients are represented by the steeper lines.
Mass balance through time
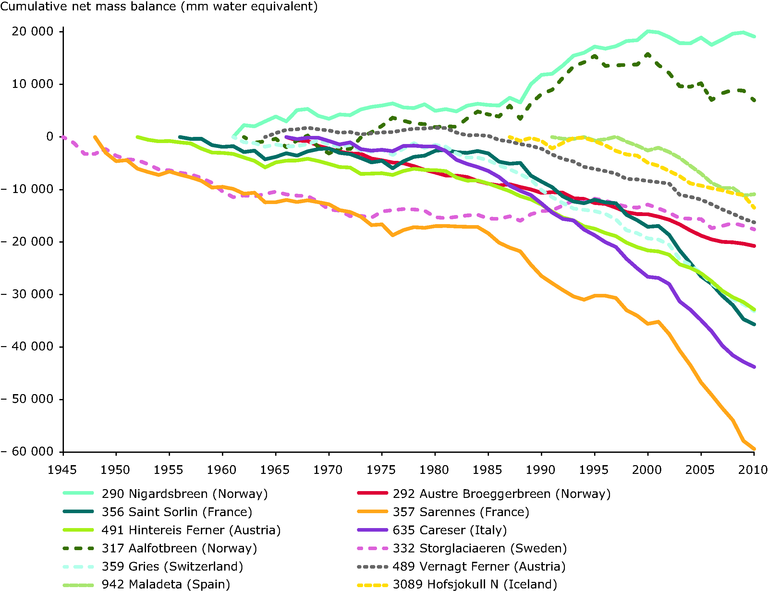
The Cumulative mass balance is the mass of the glacier at a stated time, relative to its mass at some earlier time. Some glaciers have mass balance measurements going back decades, which means that scientists can analyse how mass balance is changing over time.
These measurements give us detailed information about climate change, as glaciers are sensitive ‘barometers’ to our changing world. Usually, the net mass balance over the balance year is plotted on a graph. There are several projects monitoring glaciers all over the world, and these analyses show that glacier mass balance is generally decreasing (becoming more negative) over time.

In Europe, European Environment Agency has records of many glaciers, and makes their cumulative mass balance measurements publically available. The Glaciers (CLIM 007) analysis shows that the vast majority of European glaciers are receding, with the rate of recession accelerating since the 1980s.
The North American region shows a similar trend, with a generally declining mass balance each year.

Further afield, the IPCC AR4 shows cumulative specific net mass balance of glacierised regions worldwide. The differing behaviours of different regions shows the variable strength of climate change.

Further reading
More information on glacier accumulation and ablation
How glaciers flow:
Also of interest:
Wider reading:



u will not describe panel(a) in this document
Thanks, I have added an explanatory paragraph
Thank you very much, I found it very useful now I can show my work to Mohamed Elmi
Your statement “It is colder at the top than it is at the bottom of a glacier” has me confused. Are you not instead speaking of the head and toe of the glacier? To me, the top is the part at the surface, and the bottom is the basal layer.
Many thanks Martha for clarifying – indeed, I mean it is colder at higher altitudes at the head of the glacier.
Hey, I think you need to revise how you speak about mass balance gradients and their sensitivity. A steep mass balance gradient is typical for somewhere with little accumulation and ablation and is, therefore, less sensitive to climactic changes. “Low” mass balance gradient (less change with large height) = steep mass gradient (continental typically). The shallower, the more maritime…(I believe)
Also, I’d rather not have my name posted as this is not formulated very well..
I study soils, but wanted to make sure I fully understood a concept. Net Mass Balance (bn) is a value per unit area for the entire surface of a glacier, correct? Thus, if one wanted to compute a rough estimate of runoff, you then only need to multiply the bn by the glacial surface area. So, given that 1 sq m x 1 mm = 1 liter, 1000 L = 1 cubic m, the annual net volume water loss from a glacier with a bn of -100 and an area of 10 sq km would be 1,000,000 cubic meters of water, correct? (100 liters or 0.1 cubic meter of water per square meter, 10 sq km is 10 million sq m, so 10 million x 0.1)
I recognize this should only be considered as reliable as most back of the envelope calculations, but for an intro level course I thought it would be fun.
In long term, the climate of the Earth is going towards the next Ice Age. What is your opinion about prolongation of the current Interglacial Stage thanks to the human effact on the global climate?
What I can see about the history of global temperatures and ice volume, we are at the moment at the maximum “temperature peak”, very well comparable with those of previous interglacial stages during the latest 450 000 years. The same is valid with the total ice volumes on the Earth.
A Finnish dendrochronolocigal project “Lustia” has concluded that the average atmospheric temperatures in Northern Scandinavia are decreasing at a rate of 0.5 C / 1000 years. In such a scale, the currrent temperature increase is still in the range of the natural fluctuation.
See for example, the slide on p. 63 of the presentation in the attached link.
http://lustiag.pp.fi/data/pdf/LC_Uitto12.pdf
https://en.wikipedia.org/wiki/Ice_age#/media/File:Ice_Age_Temperature.png
How to calculate Mass change?
Mass change = precipitation – surface melt
Mass change = snowfall + Rainfall- Runoff-Sublimation -Iceberg production – Marine melt
Mass change = precipitation – surface melt – Sublimation -Iceberg production
Mass change = precipitation – surface melt – Marine melt
Mass change =
snowfall + Rainfall- surface melt- ice discharge to the ocean